Spatial Patterns
The intersection of geography and political science, or the spatial patterns of political processes is a topic that I hope to explore further in future research projects. My data collection efforts for my dissertation include geocoding techniques so scholars can explore spatial variation of military rebellion. Below, I present a number of spatial visualizations of various forms of unrest.
Heat Map of Military Mutinies 1945-2017
This map provides a visual illustration of the spatial dispersion of the data I have collected for my dissertation coding military mutinies.
Protest Location and Coups: An Example from Portugal and Iraq
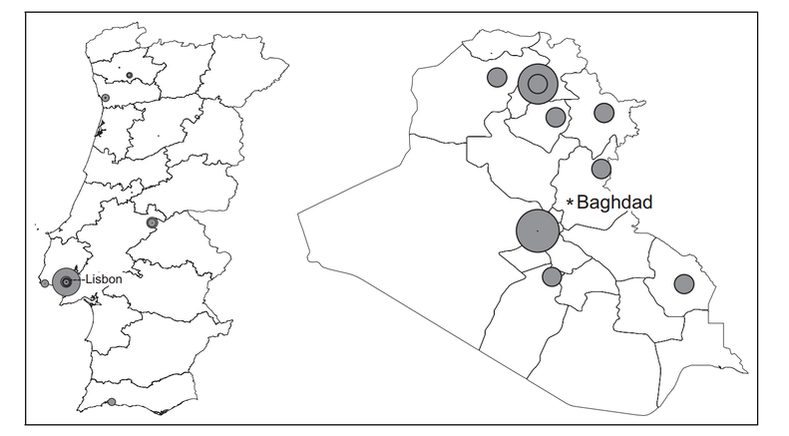
Protests size and locations in Portugal (1975) and Iraq (1991). Johnson and Thyne (Forthcoming) demonstrate that protest location can help scholars predict coup activity. These cases illustrate that when protests converge around the capital city, militaries are more apt to engage in coup activity. Illustrated by the map of Portugal, as protests converged around Lisbon the military decided to launch a coup on Nov. 26, 1975. In contrast, the protests in Iraq following the end of coalition hostilities on Feb. 27, 1991 never spurred coup activity.
Social Political and Economic Events Database (SPEED)
Global Protest Density
Visualization created using CartoDB
Notes: This map shows geocoded protest events from 1945-2005. The various colors represent varying levels of violence. These are detailed below.
No Weapons Used (light blue)
Crude Weapons Used (dark blue)
Small Arms Used (green)
Explosive Devices Used (pink)
Military Grade Weapons Used (maroon)
No Weapons Used (light blue)
Crude Weapons Used (dark blue)
Small Arms Used (green)
Explosive Devices Used (pink)
Military Grade Weapons Used (maroon)
Social Conflict Analysis Database
Egyptian Protests 1990-2014
Notes: This map displays Egyptian protests in temporal order from 1990-2014. I created this map while working on a project that explores how an individual's proximity to a protest event influences their attitudes towards political institutions, namely the military. Notice the clustering of protest events around urban centers of the state (e.g. Cairo, Alexandria, etc.) For more information about SCAD data: SCAD data.
The various colors represent the level of escalation.
No Escalation (light blue)
Organized Demonstration (dark blue)
Spontaneous Demonstration (pink)
Organized Violent Riot (maroon)
Spontaneous Violent Riot (orange)
General Strike (yellow)
Limited Strike (light green)
Anti-government Violence (dark green)
Extra government violence (black)
**For more on what each of these categories includes, visit the SCAD website.
